Oct. 20, 2021
Do We Need Behaviour Models in Transit Planning?
A response to Jarrett Walker's discussion on the usefulness of behaviour modelling in transit planning.
Recently, we’ve had a series of exchanges with public transit consultant Jarrett Walker via his blog and on Twitter about the role of access measures and behaviour modelling in transit planning and performance measurement. These conversations extend from papers in the Journal of Public Transportation by Walker in 2018 and Karner in 2021 which serve as a great basis for the discussion that follows.
Our conversations spawned a bit of a debate: Are access metrics – which measure the potential destinations we can reach with transit – sufficient for transit planning? Or are behaviour models – which attempt to predict how people make new decisions under new sets of circumstances – necessary for planning good transit?
Walker outlines many of the arguments in his paper in a 2017 video entitled Can we Live Without Prediction? In the video he lays out an argument that behaviour models are useless (and even dangerous) because they prescribe what future people’s choices and desires should be based on current-day preferences. He also puts forward the argument that access measures do not suffer this same issue. At face value it’s a reasonable fear: long-range transportation forecasts based on behavioural modelling are often wrong and have been used to perpetuate systemic racism or to justify comically bad planning.
But what about short-term models? Walker suggests in his video that offering a two-year prediction of ridership change after a network redesign in Houston is still problematic. Our position is that short-term behaviour models, ones that predict new ridership under a different system design, for example, are not prescriptive of choice and future, but are reflections of choice and present. We think that both access and people’s resulting behaviour need to be part of the conversation around network redesigns and infrastructure investments.
We see three possible sources for our differences in opinion:
- A misunderstanding of how behaviour models work.
- A conflation of behaviour modelling and transportation forecasting in transit planning.
- A belief that access measures are pure reflections of geometry and not in-and-of-themselves behaviour models.
In this post, we are going to tackle these three areas. We’ll start with an explanation of how, why, and when behaviour models work, differentiate between travel forecasting and choice modelling, and talk about access measures as behaviour models. In the concluding section, we discuss why we think both types of models and measures are needed to make good transportation planning decisions.
How, why, and when behaviour models work
Travel is a derived demand
Economists, planners, and all-around transit nerds refer to travel as a derived demand, which means that people use and consume transportation services because there is a demand to participate in an activity somewhere other than where they are. Whether it’s getting groceries, seeing friends, or going to a museum, you typically have to travel to get there.
Of course, this is a two-way street: The transportation services available to you can greatly affect your willingness or ability to participate in activities. If it’s too difficult or expensive to get to the museum, you won’t go. It’s all part of what makes public transit planning a wicked problem.
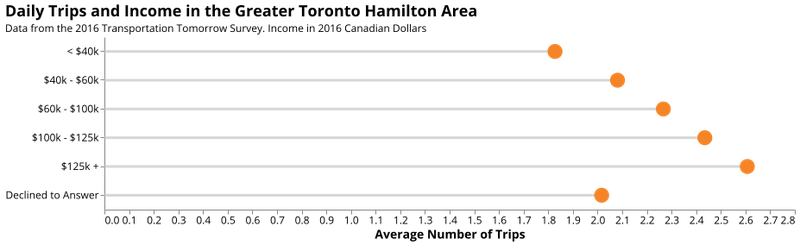
The number of trips made made correlates with income in the Greater Toronto Hamilton Area
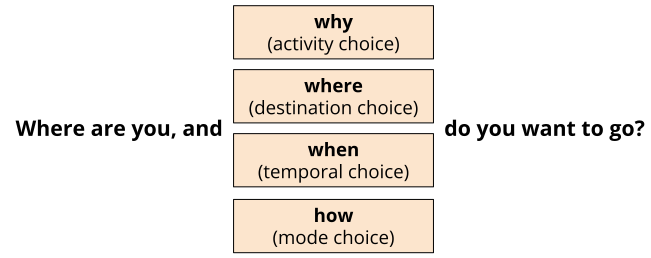
Modelling travel demand requires an understanding of why, where, when, and how people travel to participate in these activities. Answering each one of those questions requires modelling choice. Choice models take information about a set of available options and output a decision.
Behaviour models reflect observations
Models don’t just guess. Behavioural travel demand models are built upon observations taken from a large sample of people about their travel behaviour and activities over the course of a day, a week, a month, or even a year (credit to the Rembrandts for that that one). For example, one model sketched in the diagram below might take a set of observations about how people choose to travel (by bike, car, or bus) for a specific trip, along with a bunch of attributes about the people and their circumstances (green boxes), and their resulting choice (purple boxes).
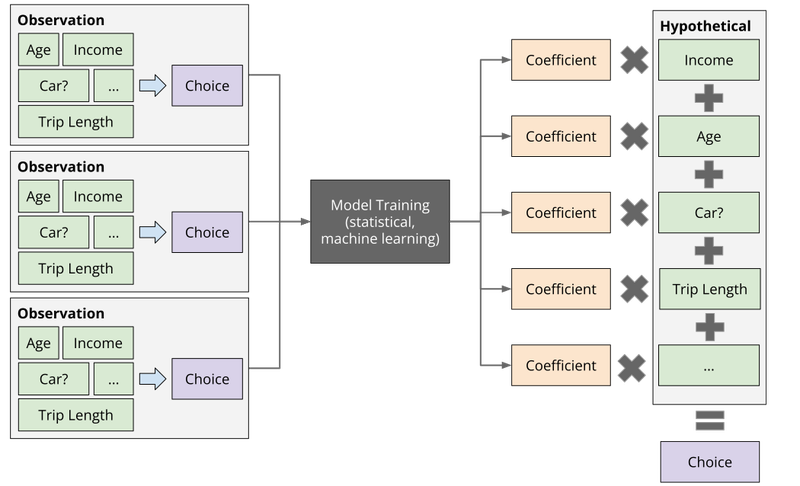
A sketch of how the modelling process works.
In the model training process, we use statistical methods to take these messy, varied observations (on the left) to identify which factors affect the choice of travel mode and how much. The goal here is to build a mathematical reflection of the inputs and resulting choice, much like engineers build scale models of waterworks, or a scientist sets up a laboratory to conduct experiments in isolated conditions.
For example, we might learn that increasing someone’s income by $10,000 has a larger effect on their decision to drive than increasing their age from 25 years old to 30. The models identify precise relationships between each factor and the ultimate choice (these relationships are embodied in the orange “coefficients” in the figure).
Let’s pause to emphasize something for a minute: The black box you see in the diagram above is math. Some mathematical methods are more appropriate than others, but they rest on the foundation of the mathematics of statistics, much like the argument for access rests on the mathematics of geometry.
Models give us a choice probability which suggests how likely a person is to choose between each of the alternatives available. We can reflect our understanding that all people and contexts are different by making our guesses on the ultimate choice random, conditioned on the probabilities that we calculate. This strategy means that even faced with the same characteristics and circumstances, a hypothetical person might make a different choice.
In addition to choice of travel mode, as described above, behavioural models include many other sub-models that capture residential and workplace location decisions, how many trips people make, how household members make trips together, where those trips go, how they are linked together into chains or tours, when people depart, and the specific routes used.
All models are wrong, some are useful
There are plenty of potential pitfalls in this process. Here's a few:
- The model training (and resulting prediction) process can feel like a black box, and if it’s not properly described, documented, or reviewed, it can be. While that doesn't make the mathematics wrong, it can make models untrustworthy or result in overconfidence.
- There are a finite number of attributes that we can include in a given model. Analysts (and some modelling processes) choose which attributes to consider based on an understanding of what’s important, but in many cases also on what’s available to observe, i.e. what data are available. This can lead to the exclusion of variables very important to decision-making. Modellers get around this by accounting for “noise”, but that noise can reduce confidence in a model’s predictive power. For example: How much would you trust a model that predicts what mode of travel you will use to get to work if it doesn’t care how long it takes to get to your destination?
- The probabilities that the models come up with, once determined, are fixed. This means that if those probability distributions change in real life, the model’s reflection of reality will suffer. That said, behavioural models are designed to account for changes in all input variables, including land-use and transportation infrastructure conditions.
While these behaviour models are inherently imperfect (as all models are), they are built on information about the choices people made and the circumstances around those choices. They are not prescriptions of what people should be doing. They are categorized reflections of observed actions.
Models, forecasts, and projections
It’s important here to distinguish between forecasts and projections. Forecasts make assumptions about how the inputs into the modelling process (population, incomes, economic strength, infrastructure) will change over time, and make the assumption that the key factors that affect our choices today will be the same far into the future. As Walker glibly summarizes: “They assume you are copies of your parents”.
Transportation forecasters use long-range model outputs to make alarmingly confident statements about the distant future. For example, the Texas Department of Transportation has forecasted a 50% increase in vehicle volumes on the most congested segments of Interstate 35 in Austin, TX – going from 200,000 to 300,000 average annual daily traffic – between now and 2045, despite making a very similar prediction in 2002 that never came to pass.
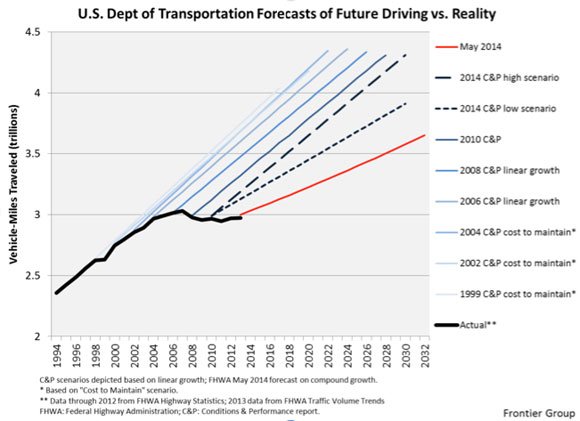
Many events that will have major effects on travel in the future are essentially unknowable: pandemics, wars, extreme weather events, new business models, and major policy changes, among others. For these reasons, forecasts are almost always wrong, as illustrated below in the figure showing the US Department of Transportation’s driving forecasts at multiple years compared to actual vehicle-miles travelled.
Projections, on the other hand, recognize that the future outcomes are contingent upon many different factors and that model outputs are affected by the quality of input data available. Walker summarizes this nicely by suggesting that “modelling insights are if-then statements”.
This leads us to our second theme: We should not conflate the impossibility of forecasting with the usefulness of behavioural models. Model estimates that are made closer to the current time are much more likely to be accurate because we know that the inputs reflect real-world conditions. While you may not know how you will choose to travel to work in 20 years, you can make a pretty good guess as to how you’ll travel to work tomorrow. We can also compare real-world outcomes to model results to assess how well they perform.
Access: A measure of potential
Access measures the potential for people to engage in activities, by collecting information about all the activities, opportunities, or destinations around a given person and weighting them in some way by how arduous it is to reach them. Walker refers to access as freedom since in general the concept measures how free you are to make different decisions about destinations to visit.
There are many ways to measure access, but two approaches are commonly used, illustrated in the diagram below:
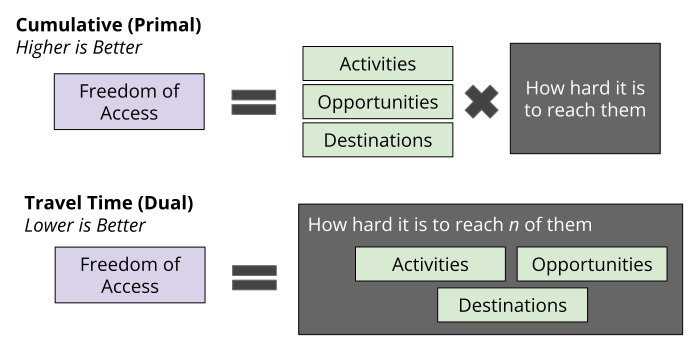
Two ways to measure spatiotemporal access in transportation
Cumulative measures count how many destinations are reachable within some travel time or some other amount of effort. Measures like this are typically reported in the form of “the number of low-wage jobs reachable within 45 minutes on public transit.” Travel-time measures reflect how long it takes (or how much effort it takes) to reach the closest (or 3rd closest, or 100th closest) destination of a given type. They are usually reported in the form of “it takes 10 minutes to reach the 2nd closest grocery store by public transit”.
Walker regularly uses cumulative opportunities measures in his analyses of transit systems, and they also undergird the University of Minnesota’s accessibility observatory. Cumulative measures are particularly well suited for situations where more is definitely better (e.g., access to employment) while the time-based measures can be used when having a substantively large degree of access is less important. For example, having convenient access to a few grocery stores nearby is good. Having access to 100 is probably not that much better since in practice you will not visit most of them. For this reason the TransitCenter Equity Dashboard uses both, depending on the destination type.
Access is a very useful measure of transportation system performance precisely because it does not rely only on transportation infrastructure. Instead, it combines information about transportation systems (how quickly and at what costs people can travel between locations in a region by various modes) and land use (where things are located). Transportation planners and engineers are very comfortable proposing and analyzing the impact of a new road or transit project on travel times and congestion, but accessibility brings land-use change into the transportation planner’s toolkit.
Now, a planner can examine how changing land use – adding mixed-use retail or denser residential development in an area for example – affects the access available in the area for different people and places. Traditional transportation performance measures, like congestion, might actually get worse if residential and employment density increase, but access will improve. In a location with high access, many destinations are located close by, so it becomes easier to chain many trips together and complete necessary activities within a short time even if the trips are happening under congested conditions.
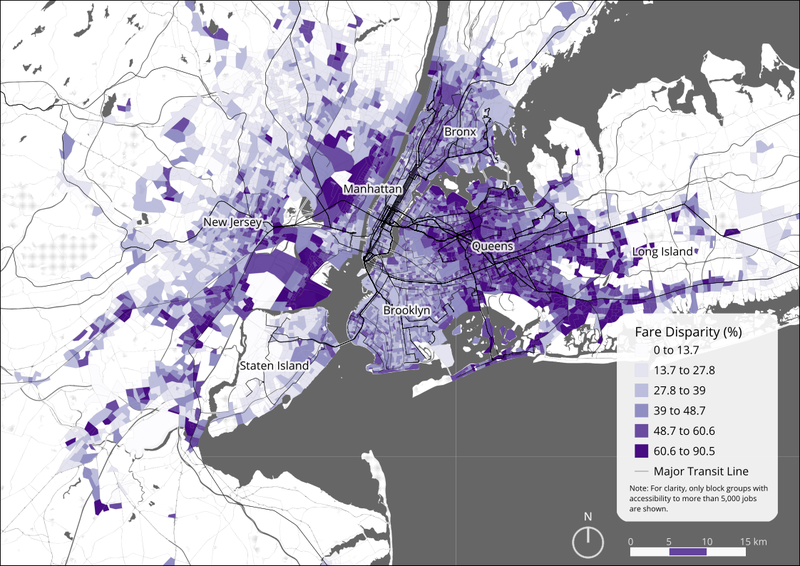
A map of how fares affect access in New York City from a recent paper
This realization – that access captures the fundamental purpose of a transportation system – might seem trivial, but it represents a sea change in how transportation system performance is measured.
For all that access measures have going for them, they present some conceptual challenges that are often raised when discussed with members of the public. These include:
- “Just because I can access something, doesn’t mean I will”. Not all destinations within reach are useful or appropriate for any given individual. Taking this a step further, it can also be difficult for someone to internally understand what access to 100,000 jobs really means. If you’re gainfully employed, this figure may not really matter at all.
- “Just because I can get there quickly on transit, doesn’t mean I will”. There are a lot of dimensions of travel that access measures don’t typically capture: safety, harassment, physical barriers, reliability, presence of law enforcement, and out-of-pocket costs. Many important dimensions that affect perceptions of access are left out of commonly used measures, including: feelings of safety, risk of harassment, physical access for people with disabilities, travel time reliability, and out-of-pocket costs, among others. Just because destinations appear to be accessible, it does not mean that they actually are for an individual traveler.
- Many of the choices that analysts have to make when calculating access measures reflect assumptions about behaviour – like the choice of a travel time threshold, whether waiting time is worse than travel time, whether the monetary cost of a trip matters, departure time, and choice of destinations to include, among others.
- Any access measures that are forward looking also fall prey to common forecasting challenges that reflect the limitations of available input data and the inability to predict the future with complete accuracy.
Walker has argued that many of the limitations above can be alleviated with more information, detail, or by using different ways of measuring access. This is true, but it is also true for behaviour models. They are both mathematical representations of a messy world.
The need for both
In his book Bad Data: Why We Measure the Wrong Things and Often Miss the Metrics that Matter, Peter Schryvers lays out a number of case studies where a single measure has led to system failure and perverse incentives.
And in the parable of the Blind Men and the Elephant, a group of blind men are presented with an elephant, a creature they haven’t met before. Each man feels a different part of the creature and draws a different conclusion about what object it is: The trunk is a snake, the tail is a rope, and the side is a wall. Their inability to communicate and incorporate others’ information into their own model leads to division.
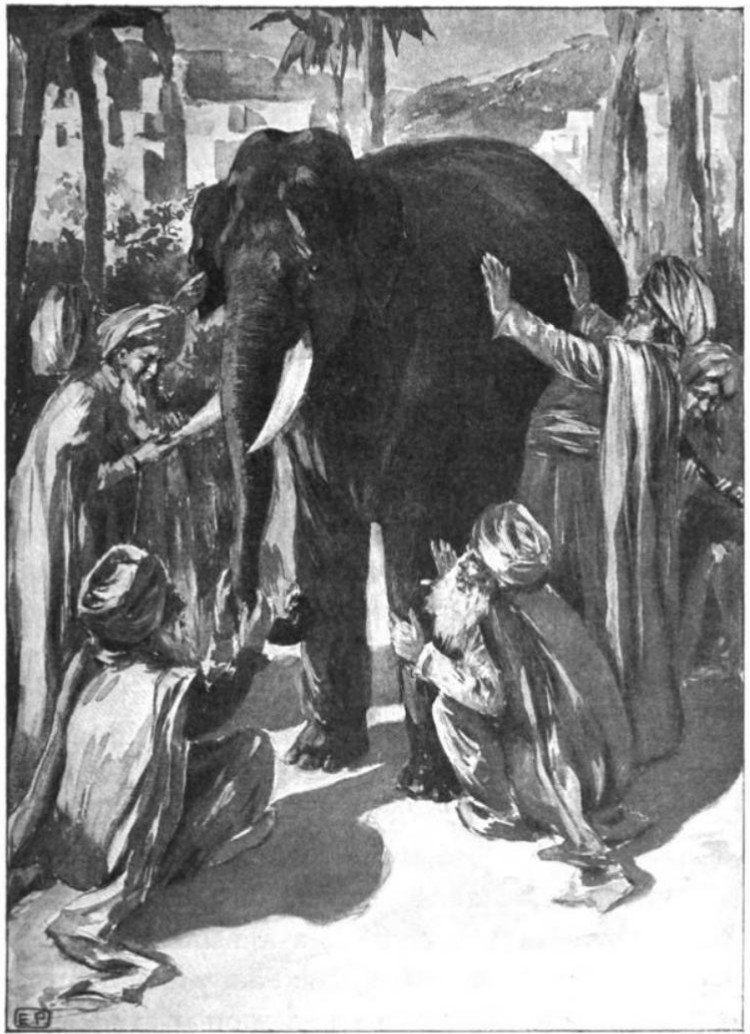
We all have partial perspectives of the whole
The key here is that there is absolutely no need to limit a particular performance analysis to a single measure (or type of measure) but not another. Each time you measure a complex system in a different way, you gain information about it you wouldn’t otherwise have. As transit planners facing a wicked problem, we can only measure the systems we’re designing in limited ways.
But it’s not enough to just compute. We need to recognize the limitations inherent in each measure and share them openly, as we detailed above.
Access measures give you a sense of how easily people can reach potential destinations. Behavioural models give you a sense of how people are actually travelling throughout a region. If we’re contemplating near-term changes to the public transit system or to land uses, those models can give us a decent sense of how people will respond, who benefits from the changes, and who loses.
If both access scores and behavioural outcomes show improvements for a group, that’s great. You can be more confident that your project or plan truly benefits that group. If only access improves but behavioural outcomes worsen or are ambiguous, that likely means that the increased access is not actually well-matched to traveller needs. On the other hand, behavioural outcomes could improve while access degrades. That could mean that people are making less desirable choices about their destinations – choosing a grocery store or school that’s less than ideal – or forgoing certain trips all together. In any of these cases, interpreting the information from the performance measures together is what’s important.
And then there’s the practical comparison: Access scores can be readily calculated using publicly available data on public transit routes and schedules along with other open data on destinations. Free software is available to calculate travel times throughout a network on public transit. Behavioural models, on the other hand, have more demanding data inputs and require more prior knowledge – in modelling and statistics – on the part of the analyst. Different modellers will come up with different answers, depending on the factors that they include or exclude and the types of models they use.
While you would be justified in asking whether the additional effort required to estimate behavioural models in addition to access scores is worth it, it would be unwise to limit your choice of measure based on the effort required to measure it.
Even though access scores can be understood by members of the public and other transportation planners, travellers often want to know how proposed system changes will affect them, given the travel needs that they have today. The ability to access 100,000 jobs on public transit is difficult to intuitively feel, given that any individual currently has a set of specific trips that they need to complete, often in a set order (to work, to daycare, to worship, to eat, to meet their friends, etc.).
Simplification and focus is important, but we must always be wary that we don’t end up as blind men with an elephant. Our hope is that further conversations with planners, advocates, agencies, and researchers leads us away from overconfidence in any given measure, and towards a more nuanced understanding of transit systems.