There's more to discover about your transit system.
We help planners, policy makers, and advocates better understand their transit systems with thoughtful research, advanced data analytics, and compelling communications.
What We Do
The amount of data that transit and other transportation systems are producing is increasing steadily. Whether from sensors, payments, surveys, or social media, much of that data can be used to more accurately identify areas for improvement, support positive policy changes, or communicate more clearly and efficiently with customers.
The trouble is, agencies, planners, and advocates often lack the tools or internal capacity to leverage data to its fullest extent. That's where we come in. We develop and lead analysis projects from start to finish, including research design, data wrangling and analysis, reporting, and web development to intuitively showcase results.
We also develop tools to help others analyze their system more easily. This enables non-technical staff to leverage techniques and data sets through semi-automated, informed processes.
If you would like to learn more about your system, push for better transit, or develop custom tools to support your staff, please reach out, or learn more about our past projects.
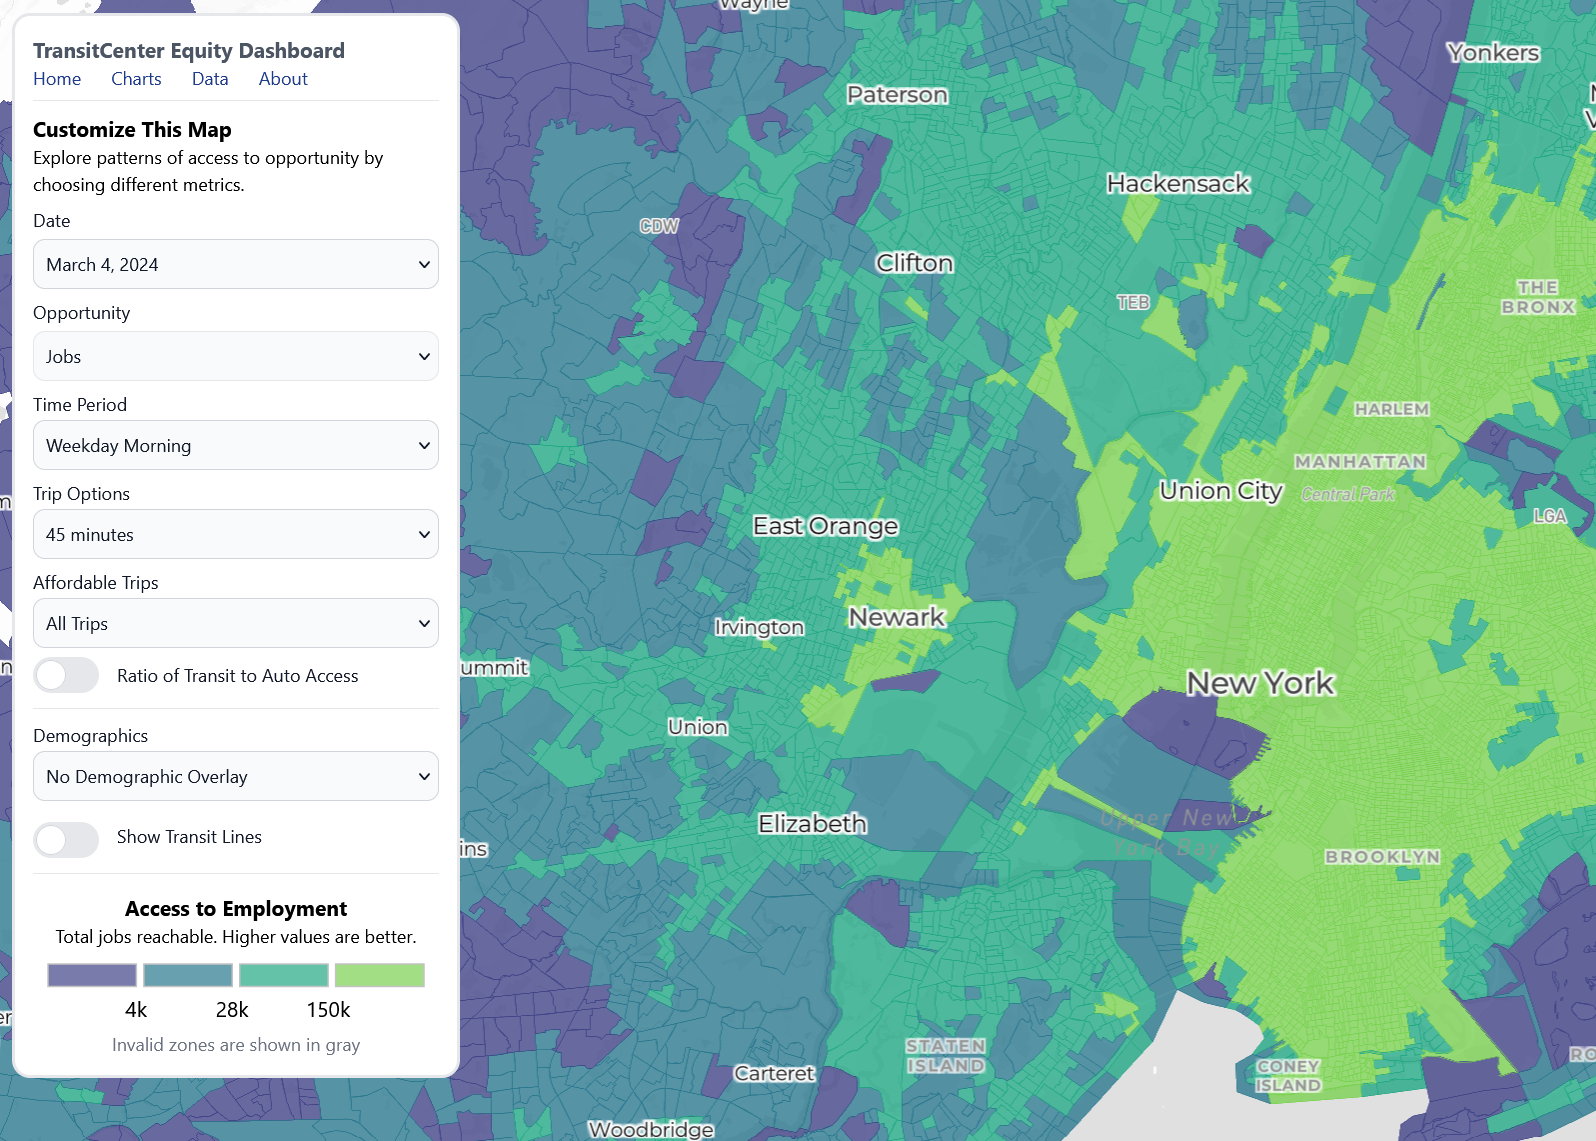
- Learn how levels of transit service and acess to opportunities are distributed among population groups. Evaluate new transit projects and network redesigns through an access and equity lens.
- Access and Equity
- Use your operational data to dig into the performance of your transit system using advanced analysis and metrics. Find operational bottlenecks and use them to prioritize planning projects.
- Reliability and Crowding
- See and model how pedestrians, cyclists, and transit riders move around cities, and gain insight into the day-to-day experiences of users through the analysis of mobile phone and WiFi connection data.
- Patterns of use

Willem Klumpenhouwer
Willem is a public transit and rail research consultant with 10+ years of professional and academic experience in data-driven analyses and modelling of urban transportation systems.
Willem has a unique ability to bridge the gap between complex analysis, emerging research, and practical application and implementation. On the theoretical side, Willem holds a Bachelor's degree in Theoretical Physics from the University of Guelph and a PhD in Transportation Engineering from the University of Calgary. He has published in top transportation engineering and geography journals and held numerous research awards, including from Canada's National Science and Engineering Research Council.
Willem has worked as a rail traffic controller at Canadian Pacific Railway and a policy advisor at the Ministry of Transportation Ontario. He has helped develop data analytics and communication products and supported the development of funding agreements for major transit projects. He is the designer of the TransitCenter Equity Dashboard, a custom-built visualization application for transportation access and equity in major U.S. urban areas. He has worked with transit agencies such as Metrolinx and Calgary Transit to develop applied methods of analyzing railway delay data and leveraging social media for insights on emerging incidents and service evaluation.
Willem also has a knack for communicating complex ideas in a clear and concise way. He has designed and taught courses in public transit operations, planning, and data analytics at the University of Toronto and lectured at the University of Calgary and Toronto Metropolitan University, receiving consistently positive student feedback. He has written for CBC, the Globe and Mail, and the Calgary Herald.
You can learn more about Willem's work history and experience by visiting his LinkedIn page.